FIND A STOCKIST
Headlines – Increased Creation, VEEC Price Rise, 21A announcements & 2018 Target Surrender
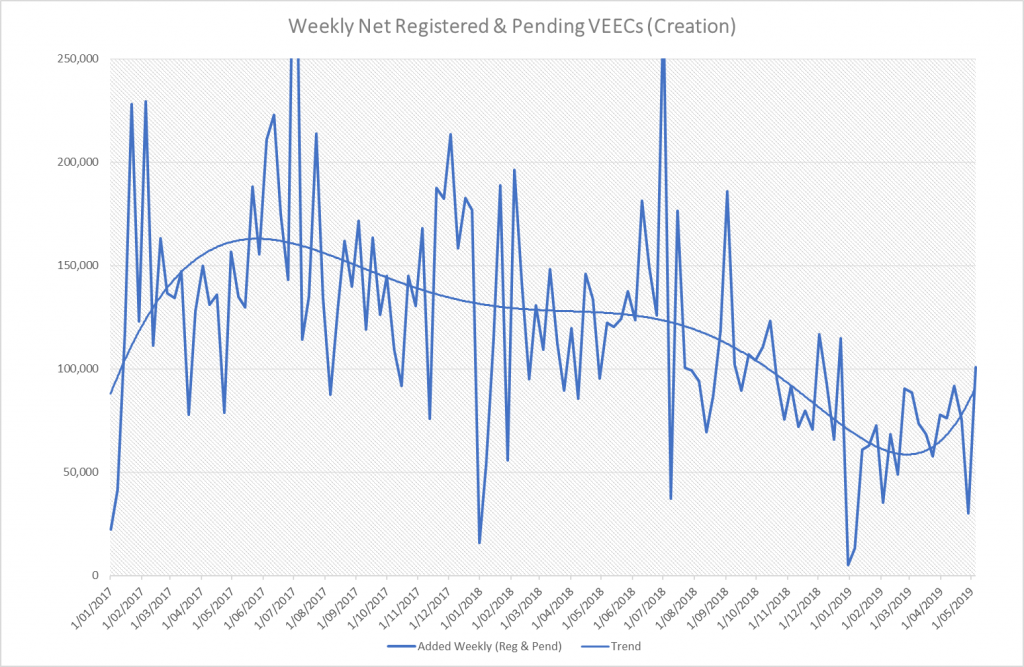
- Due to the Easter break disruptions, the results for the two previous weeks are understandably not representative of current trends due to disruptions in processing certificates.
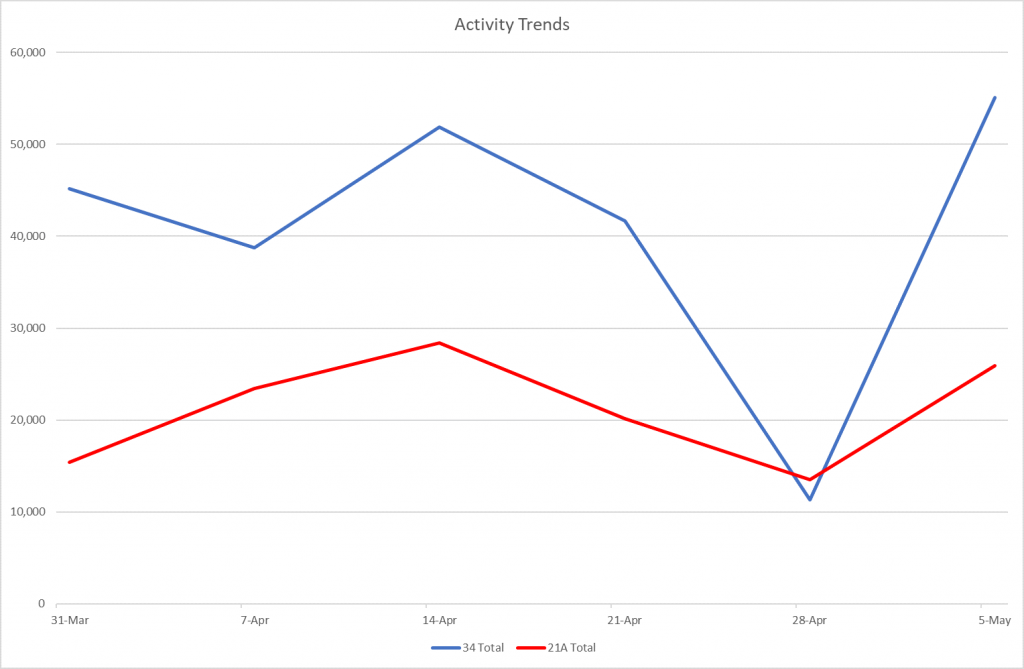
- Last week saw an increase in creation as APs returned to work post Easter with over 100k VEECs created. Please refer to the graph below of the two most popular activities.
- During the post Easter period the VEEC price rose by a dollar from $21.00 to $22.00.
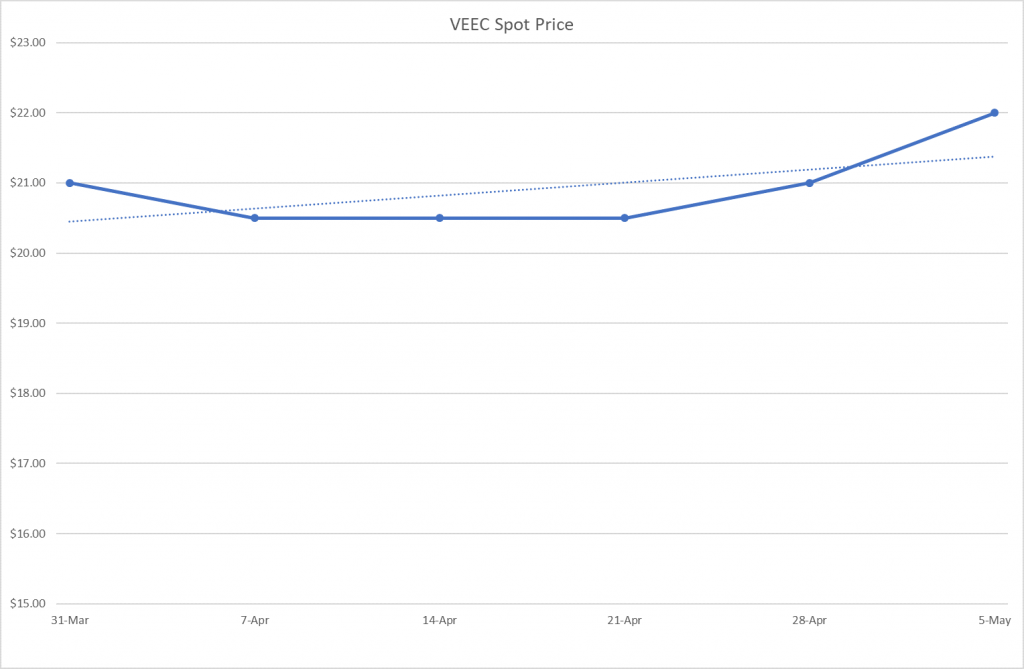
- Two weeks of (artificial) low creation over this period could possibly explain the bump in VEEC spot price.
- The announcement by the ESC to extend the 21A non-omnidirectional transition period by one month to 31st July is unlikely to be responsible, and in fact, was announced after the price had moved. For announcement details please refer to link program update
- The ESC also released guidance to advise all APs performing Residential upgrades (e.g. 21A) that they must ensure all installers use non-conductive portable ladders compliant with AS/NZS 1892.5 (Portable ladders: Selection, safe use and care). Refer to link program update for more details.
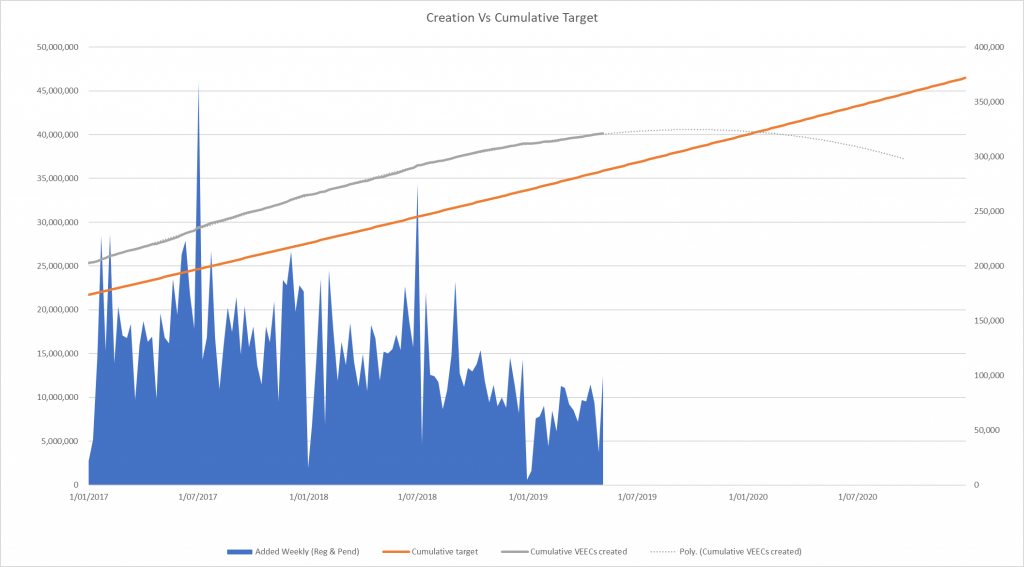
- The 2018 VEU target surrender date has passed at the end of April with 6.384M VEECs pending surrender against the 2018 target of 6.1M. This is slightly more than the expected target indicating electricity usage was higher than expected over the year.
- The 2019 target is 6.3M with currently 5,978,619 Registered or Created. (5.3M already Registered, 667,719 pending authorisation & 38,385 pending registration)
- Meaning the 2019 target requires only 320,000 more VEECs to be created between now and the end of the year to satisfy this target.
- At the current average creation rate of 68k VEECs per week, this means the provisional target will be reached in 5 weeks’ time by mid-June.
- However, in order to reach the 6.5M VEECs required for the 2020 surrender, an average of 80k VEECs need to be created every single week from this week until the end of 2020.
- This represents a much higher, nearly 20%, creation rate than current trends (68k per week) and weekly creation has only exceeded 80k 4 times in 2019 out of 18 weeks and only exceeded 100k once (last week).
- Below are last week’s results for in detail.
Results
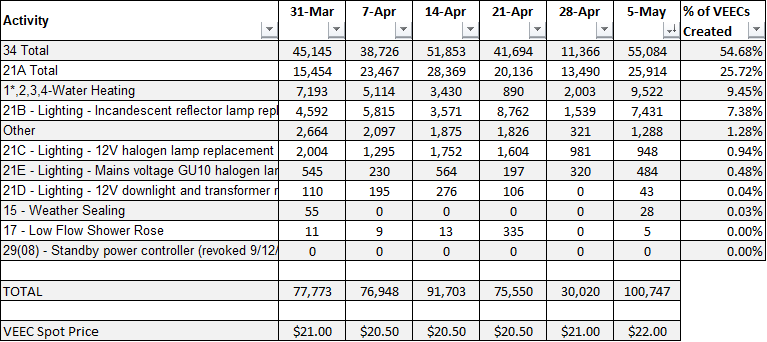
In the week ending 5th May 2019, VEEC creation was as follows:
- 100,747 up 236% compared to the previous week’s creation of 30,020.
- The average for the last 3 weeks is now 68,772
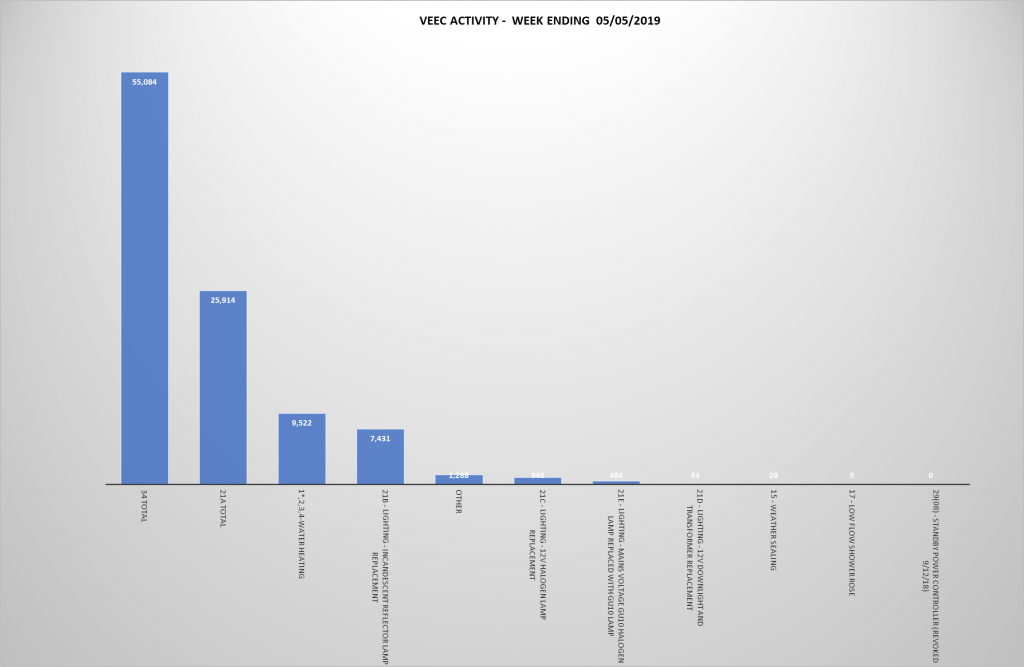
- Commercial Lighting contributed 55,084 (55%) compared to 11,366 (38%) the previous week
- Updated 21A contributed 25,914 VEECs (26%) created compared to 13,490 VEECs (45%) the week before.
- The VEEC spot price was $22.00 COB Friday, up $1 from the previous Friday
The VEEC spot price was $20.50 COB Friday, unchanged from the previous Friday.
Analysis
The graph below shows the overall trend of total VEECs created each week.
The graph below shows creation against targets. The right hand axis is for the cumulative creation and cumulative target, and the left hand axis the weekly creation. Please note, this is creation – not all VEECs created are registered.
To give you a visual breakdown of Activities for the week, please see below.